← Home · Laboratory

Atterberg Limits Testing in Knoxville – Plasticity & Soil Classification

Together, we solve the challenges of tomorrow.

SEE MORE →

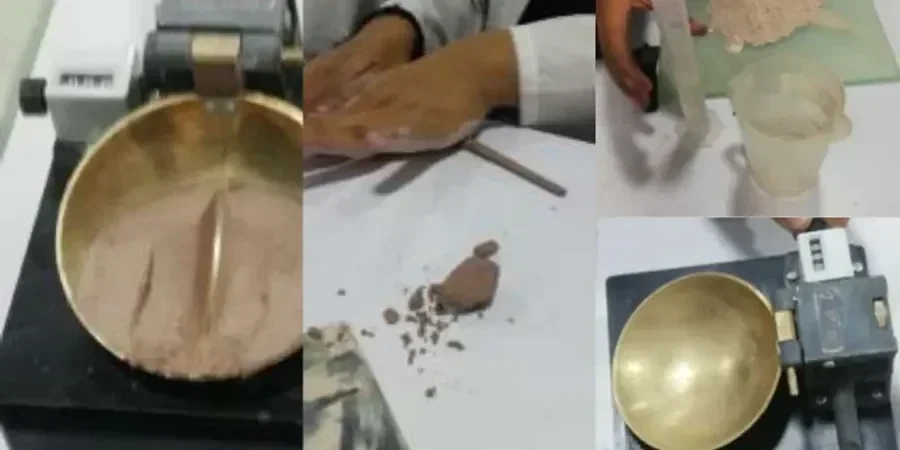
The difference between a stable foundation in Sequoyah Hills and settlement problems in parts of South Knoxville often comes down to the soil's plasticity. The clay strata along the Tennessee River, with its high seasonal moisture variation around the 35.96° N latitude, can behave very differently depending on the specific mineralogy. Our lab runs Atterberg limits testing following ASTM D4318 to quantify the liquid limit, plastic limit, and plasticity index of fine-grained soils. This isn't just about classifying soil; it’s about predicting how the ground will react to Knoxville’s wet winters and humid summers. We routinely combine these results with grain size analysis to build a complete picture of the material passing the No. 200 sieve, a critical step before any compaction or foundation design.

The plasticity index isn't just a number for the boring log; it’s a direct input for estimating the swell potential and effective friction angle of Knoxville's residual clays.

Process overview

A common mistake we see is contractors treating all Knoxville-area clays as identical, which leads to misjudging cut slope angles and fill compaction behavior. The red residual clays derived from the Knox Group dolomites have a much lower plasticity than the alluvial clays found near First Creek. We determine the Atterberg limits by precisely measuring the moisture content at which the soil transitions from a plastic to a liquid state. The test is operator-sensitive, so our technicians follow the multi-point method in ASTM D4318 with rigorous calibration of the Casagrande cup. For projects with deep excavations near the downtown core, we often recommend pairing this with slope stability analysis to use the plasticity index directly in the strength models. The liquid limit alone can tell you a lot about compressibility, but it’s the plasticity index that really drives the engineering decisions.
Atterberg Limits Testing in Knoxville – Plasticity & Soil Classification
Technical reference image — Knoxville

Local context

When you see a pavement section on I-40 develop deep rutting or a residential footing in West Hills show exaggerated cracking, the root cause is often a misclassified high-plasticity silt. We’ve seen situations where fat clays (CH) with a liquid limit above 50% were compacted at the wrong moisture content, creating a nightmare for the drainage layer. Ignoring the Atterberg limits on a site with expansive potential doesn’t just risk some settlement; it can lead to a complete structural failure when the dry season hits and the soil shrinks away from the footing. Knoxville’s geology, with its interlayered shale and limestone residuum, produces soils that can look identical in the hand but have a 20-point gap in plasticity. You don’t want to guess that difference.

Need a geotechnical assessment?

Reply within 24h.

Email: contact@geotechnicalengineering.biz

Technical parameters


ParameterTypical value
Test StandardASTM D4318-17e1
Liquid Limit MethodMultipoint Casagrande Cup
Plastic Limit MethodRolling Thread (3 mm diameter)
Sample PreparationWet preparation, sieved through No. 40
Typical Liquid Limit Range (Local)35% – 72%
Plasticity Index OutputReported to nearest 1%
Classification UseUSCS (Unified Soil Classification System)

Additional services

01

Liquid & Plastic Limits

Full multipoint analysis using the Casagrande percussion cup method and rolling thread technique to define the Atterberg boundaries.

02

USCS Classification Package

Combined test suite including Atterberg limits, hydrometer analysis, and sieve data to generate a complete ASTM D2487 soil classification.

03

Moisture-Strength Correlation

We correlate the plastic limit with optimum moisture content from Proctor tests to flag sensitive soils before construction compaction begins.

Reference standards


ASTM D4318-17e1, ASTM D2487-17e1, AASHTO T 89-13

Common questions

What exactly do the Atterberg limits measure?

They measure the critical moisture contents at which a fine-grained soil changes state. The liquid limit is the boundary between liquid and plastic states, the plastic limit is the boundary between plastic and semi-solid states, and the plasticity index is the numerical difference between them. These values define the soil’s behavior under load.

How much does a standard Atterberg limits test cost in Knoxville?

A standard set of Atterberg limits (liquid and plastic limit determination) typically falls in the US$50 to US$90 range per sample, depending on whether it’s a single-point or full multipoint test and the turnaround time required.

Why can’t I just use a visual classification instead of lab testing?

Visual classification can’t reliably distinguish between a low-plasticity silt (ML) and a high-plasticity clay (CH). In Knoxville’s residual soils, a material that looks like a lean clay can easily have a liquid limit over 50%, which completely changes the design parameters for bearing capacity and settlement.

Location and service area

We serve projects across Knoxville and its metropolitan area.

View larger map